10 Tips for Sourcing Artificial Graphite Suppliers?
Sourcing reliable Artificial Graphite suppliers requires more than comparing prices on a spreadsheet. Buyers must examine purity, particle size, graphitization temperature, production capacity, and quality consistency. A supplier may offer an attractive quotation, yet provide limited technical data. That is a warning sign. Small variations can affect conductivity, tap density, battery performance, and final manufacturing costs.
Simon Moores, founder and chief executive of Benchmark Mineral Intelligence, has said, “Graphite is the largest component by weight in a lithium-ion battery.” His observation explains why supplier selection deserves careful attention. Artificial Graphite is not a simple commodity. Its performance depends on raw material control, furnace conditions, processing equipment, and testing discipline. This outline presents ten practical tips for evaluating suppliers, from checking certifications and factory capability to reviewing sample results and long-term supply stability. It also considers communication speed, packaging, logistics, and technical support.
Experience often reveals what brochures hide. Ask for batch records, inspection reports, and realistic lead times. Visit the plant when possible. Speak with production staff, not only sales representatives. Still, no sourcing method is perfect. Laboratory samples may not represent full-scale deliveries, and even reputable suppliers can face energy or equipment problems. That uncertainty deserves honest attention. A careful buyer should build contingency plans, define acceptance standards, and test material before approving large orders. The goal is not merely to find an Artificial Graphite supplier. It is to find a dependable technical partner. That takes evidence.
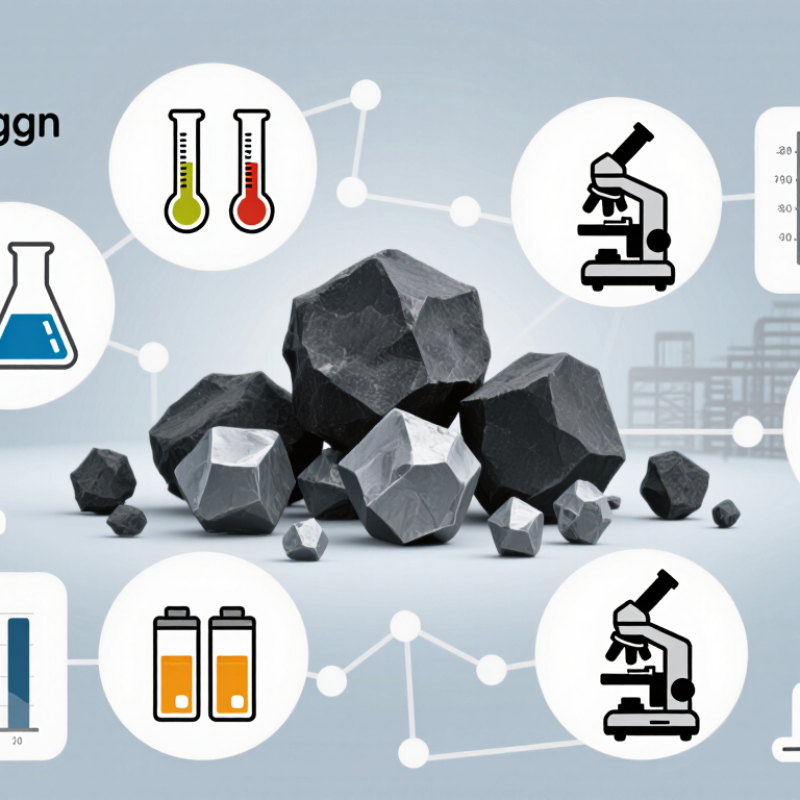
Define Artificial Graphite Grades: ≥99.95% Purity and 372 mAh/g Capacity
When sourcing artificial graphite, define the grade before comparing supplier prices. A practical baseline is at least 99.95% carbon purity, measured by a stated testing method. Confirm whether this figure excludes moisture, ash, and volatile matter. Small differences can affect electrode consistency.
The 372 mAh/g figure needs careful interpretation. It represents graphite’s theoretical specific capacity, not an automatic production guarantee. Ask suppliers for test data showing reversible capacity, first-cycle efficiency, voltage range, current density, and cell design. A reliable report should identify the sample lot and testing date. Particle size distribution also matters. For example, D50, tap density, moisture, and surface area can influence coating behavior and cycling stability.
Request a certificate of analysis for several lots, not just one polished sample. Compare laboratory results with your own verification testing. A clean certificate is not enough. I once treated purity as the main quality signal, then found that unstable particle sizing caused poor slurry flow. That assumption needed correction. Suppliers should explain their graphitization process, impurity controls, packaging, and storage conditions. Check whether the quoted 372 mAh/g is measured capacity or theoretical capacity. This distinction prevents unrealistic purchasing decisions. Experienced suppliers welcome technical questions and provide traceable records. Vague answers deserve a pause.
Artificial Graphite Sourcing Benchmark: Purity and Capacity
A 99.95% purity specification allows no more than 0.05% non-carbon content, equivalent to 500 ppm. The 372 mAh/g value represents the theoretical specific capacity of graphite based on the LiC₆ stoichiometry; actual supplier results depend on particle structure, coating, testing conditions, and electrode design.
Verify Manufacturing Processes: 2,800–3,000°C Graphitization and Particle Control
A reliable artificial graphite supplier should prove its graphitization capability, not merely quote a furnace temperature.
Ask for batch records showing treatment between 2,800 and 3,000°C, residence time, furnace atmosphere, and temperature uniformity. Small variations can change crystallinity, electrical resistance, and oxidation behavior.
In production audits, inspect furnace logs and retain samples from different furnace zones.
That evidence matters.
Particle control deserves equal scrutiny. Request laser-diffraction results, including D10, D50, D90, span, moisture, ash, and magnetic impurity data. ISO 13320 supports laser-diffraction particle-size analysis, but test preparation can still distort results. Ask for the sampling method. One scoop is not enough.
The International Energy Agency’s Global Critical Minerals Outlook 2024 identifies graphite as a rapidly expanding battery-material demand, increasing pressure on consistent supply. The U.S. Geological Survey’s Mineral Commodity Summaries 2025 also highlights graphite’s importance across batteries, refractories, and lubricants.
A capable supplier should connect particle size with your process.
Fine powder may improve packing, yet increase dust and handling losses.
Larger particles can improve flow, but reduce packing density.
Request three consecutive production lots, not one polished laboratory sample. Confirm whether classification occurs after graphitization, because thermal treatment can alter agglomeration. I would also challenge unusually perfect data; real processes show variation. That imperfection needs explanation, control limits, and corrective records.
Assess Supplier Quality Systems: ISO 9001, Batch Testing, and ≤1% Moisture
When sourcing artificial graphite, supplier quality systems deserve more attention than a polished catalogue. Ask for current ISO 9001 certification and verify its scope. It should cover graphite processing, testing, or both. A certificate alone proves little. Review internal procedures, corrective-action records, and calibration logs. This reveals whether quality is managed daily, not displayed during sales calls.
Batch testing should be specific to your application. Request results for fixed carbon, ash, particle-size distribution, bulk density, and moisture. Each report should identify the lot number, production date, test method, and sampling plan. Compare results from several batches, not one selected sample. Keep a sealed retain sample for independent checks. Small details matter. If values drift, ask how the supplier investigates and controls variation.
Moisture deserves a clear acceptance limit of 1% or less, measured by a stated method. Confirm whether testing occurs after drying, before packing, or at shipment. Bags stored in a damp warehouse can undo good processing. Inspect packaging, warehouse conditions, and loading practices when possible. I once treated a passing moisture result as final evidence. That was too optimistic. Later handling changed the material’s condition. A stronger process links moisture testing with sealed packaging, transport records, and arrival inspection. Some suppliers may resist these questions. That resistance is useful information.
Compare Technical Fit: 10–20 μm D50, Tap Density, and Impurity Limits
When sourcing artificial graphite, begin with the particle-size window, not the supplier’s sales language. For many powder applications, a D50 between 10 and 20 μm offers a practical starting point. Ask whether D50 comes from laser diffraction, and request the full distribution, including D10 and D90. A single average can hide coarse particles that damage coating uniformity. Check the test sample date. Fresh data matters.
Tap density must match the process, not merely look impressive on a datasheet. Measure it using a stated cylinder volume, tapping rate, and number of taps. Two laboratories can report different values from identical graphite when methods differ. During trials, compare loose density, tap density, flow behavior, and packing after vibration. Record moisture and sample conditioning. Small details matter.
Impurity limits deserve equal attention. Specify ash, iron, copper, sulfur, and moisture in numerical limits suited to your product. Request batch-level certificates and independent verification for the first few lots. Inspect sample preparation, instrument calibration, and detection limits. Supplier capacity also matters: can the same D50 and tap density survive scale-up? I would not approve a source after one attractive sample. That is a common mistake. A second trial may reveal drift.
Evaluate Supply Security: Capacity, Lead Times, ESG Data, and Total Cost
When sourcing artificial graphite, supply security starts with verified production capacity, not a polished sales forecast. Ask for nameplate capacity, current utilization, maintenance schedules, and expansion dates. Request three months of output records, where available. A site audit or live video walkthrough can expose bottlenecks in milling, coating, or final inspection. Capacity on paper means little. Check whether critical equipment has spare parts and trained operators. Ask how the supplier handled a sudden order increase during the last twelve months. Their answer reveals more than a brochure.
Lead time should be measured from purchase order to accepted goods, including testing and export preparation. Get normal, peak, and disruption scenarios in writing. I would also request a sample delivery calendar with batch sizes, port options, and safety-stock assumptions. Trial orders matter. They reveal packing damage, documentation gaps, and test delays that spreadsheets hide. A shorter quoted lead time is not automatically safer. It may indicate optimistic planning.
ESG data must be specific enough to audit. Request energy use per tonne, electricity sources, water consumption, waste controls, and recent third-party findings. Missing data is a risk, not a neutral detail. Compare total cost, including freight, inspection, rejected batches, inventory financing, and emergency transport. A low unit price can become expensive after one delayed shipment. Build a weighted scorecard, then challenge your own assumptions. I once favored a cheaper offer and underestimated qualification time. That mistake belonged in the model.
10 Tips for Sourcing Artificial Graphite Suppliers? - Evaluate Supply Security: Capacity, Lead Times, ESG Data, and Total Cost
| Supplier Profile | Annual Artificial Graphite Capacity | Available Capacity for New Contracts | Standard Lead Time | Expedited Lead Time | Raw-Material Security | ESG Data Availability | Carbon-Intensity Disclosure | Indicative Product Price | Estimated Landed Cost | Supply-Risk Score | Recommended Verification |
| Profile A | 20,000–35,000 t/year | 15–20% | 6–8 weeks | 3–4 weeks | Multi-source needle coke; annual supply contracts in place | Audited energy, water, waste, and safety records available | Verified product-level data
0.9–1.4 t CO₂e/t product | US$1,650–2,050/t | US$1,850–2,350/t | Low | Confirm allocation rights and audit the mass-balance method |
| Profile B | 8,000–15,000 t/year | 10–15% | 8–12 weeks | 5–6 weeks | Two qualified coke sources; one source represents more than half of volume | Annual environmental data available; limited third-party assurance | Plant-level estimate
1.5–2.3 t CO₂e/t product | US$1,500–1,900/t | US$1,750–2,250/t | Moderate | Request source-concentration data and a contingency production plan |
| Profile C | 40,000–70,000 t/year | 20–30% | 4–6 weeks | 2–3 weeks | Integrated processing with captive power and diversified feedstock | ISO-certified systems; monthly energy and yield reporting available | Third-party verified
0.7–1.2 t CO₂e/t product | US$1,800–2,300/t | US$1,950–2,550/t | Low | Validate that spare capacity is reserved for the buyer |
| Profile D | 5,000–10,000 t/year | 5–10% | 12–16 weeks | Not routinely available | Single-region feedstock base with limited backup inventory | Basic compliance documents; no independent ESG assurance | Not product-specific
Corporate estimate only | US$1,300–1,700/t | US$1,650–2,200/t | High | Require safety stock, dual sourcing, and an independent ESG audit |
| Profile E | 15,000–25,000 t/year | 10–18% | 7–10 weeks | 4–5 weeks | Regional sourcing network; documented business-continuity procedures | Scope 1 and 2 data available; Scope 3 data under development | Partial verification
1.2–1.9 t CO₂e/t product | US$1,550–2,000/t | US$1,800–2,400/t | Moderate | Set measurable Scope 3 reporting and service-level targets |
| Profile F | 10,000–18,000 t/year | 15–25% | 5–7 weeks | 3–4 weeks | Two production sites and a minimum 30-day finished-goods buffer | Audited environmental permits, water data, and worker-safety metrics | Verified site-level data
1.0–1.6 t CO₂e/t product | US$1,700–2,150/t | US$1,950–2,500/t | Low to moderate | Test inventory accuracy and confirm the second-site qualification status |
Evaluation notes: Capacity should be checked against demonstrated production output rather than nominal equipment capacity. Lead times should include production, quality release, inland transport, export handling, and ocean freight where applicable. Estimated landed cost includes product price, packaging, inland freight, ocean freight, insurance, duties, and routine quality inspection, but excludes taxes, financing costs, and extraordinary surcharges. Carbon-intensity figures are expressed as tonnes of CO₂e per tonne of artificial graphite and should be verified through site records, energy invoices, system boundaries, and an independent assurance statement before contract award.